Latest event covered: South East Queensland, 27 October 2026
Know where the hail fell, and how big.
After major storms in South East Queensland and Sydney we collate the radar, the sizes and the affected suburbs for you, so you start work where the damage is.
Join and pay $42.90 a month other plans
Not ready yet? Get updates by email
Join and pay
Pick a plan and pay securely with PayPal or a card. Prices include GST. Your membership starts when you pay. Maps, suburb lists and site checks for each major storm event are sent to you by email.
Members monthly
$42.90 a month incl. GST
Every event: suburb level map, suburb list and an email after each event. Cancel any time in PayPal.
Site checks for your business
$86.90 a month incl. GST
For body shops, car yards and depots: a site check for each of your addresses after each event.
Adds the known car yard and panel shop list
$163.90 a month incl. GST
Our top level. Site checks after each event, plus the list of known car yards and panel shops inside each hail swath, with the estimated hail size near each. Business details come from public map data and can be out of date, so check before you visit.
Estimates come from radar and can read higher than the stones on the ground. Not a warning. Results are sent by email after each event. Questions: 0408 020 468.
Your products, side by side
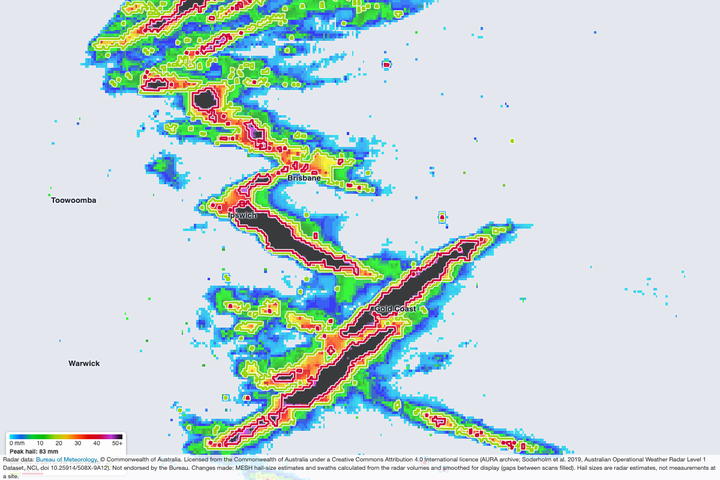
Everything below is built from the South East Queensland event of 27 October 2026, using real radar numbers. Technicians, roofers, body shops, car yards, fleets and depots each use it differently.
1. Event picture
The whole event at a glance. Shareable.
2. Suburb level map
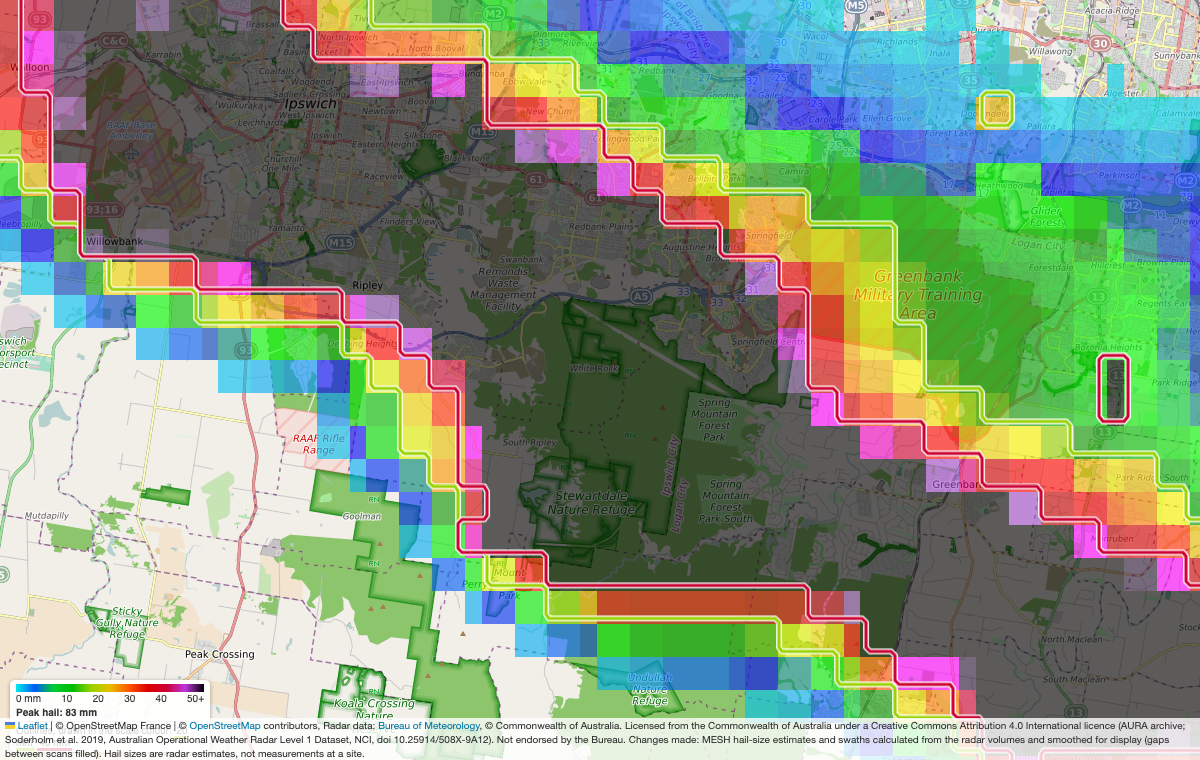
Zoom to the suburb. Estimated size under every square.
3. Affected suburbs list
| Suburb | State | Radar estimate |
|---|---|---|
| Redbank Plains | QLD | 77 mm |
| Springfield | QLD | 70 mm |
| Ripley | QLD | 69 mm |
| Flinders View | QLD | 69 mm |
| Nerang | QLD | 69 mm |
| Ipswich | QLD | 68 mm |
| Southport | QLD | 68 mm |
| Yamanto | QLD | 65 mm |
| Mudgeeraba | QLD | 64 mm |
Largest first. Estimated size within 3 km of the suburb centre, 27 Oct. Radar can read higher than the stones found on the ground.
4. Site check: yards, shops, depots
A suburb centre used as an example, not a customer.
Give us your addresses. After each event we tell you which were hit and by how much.
5. Email after every event
Ripley: largest estimated hail within 1 km is 68 mm (40 mm or more estimated).
Map, suburb list and how the estimate was made are attached.
Sample layout.
Estimates come from radar, can read larger than stones found on the ground, and are not a warning or a certified report.
Exactly what you get: suburb level, every event
These are real examples from this season, shown at the detail members see. Each one is built from the Bureau of Meteorology radar archive.
Ipswich to Ripley and Springfield. Peak estimate for the event: 83 mm. Outlines mark 20 mm (lime) and 40 mm (red).
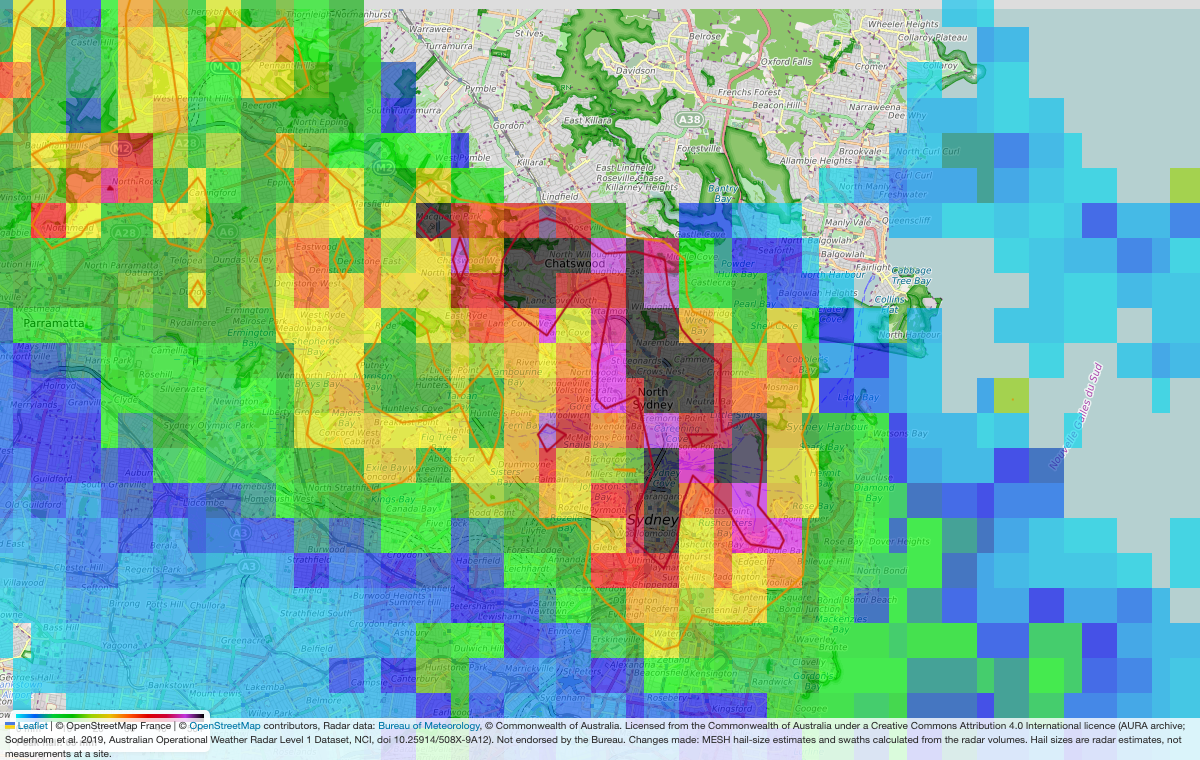
Chatswood, North Sydney and the inner suburbs.
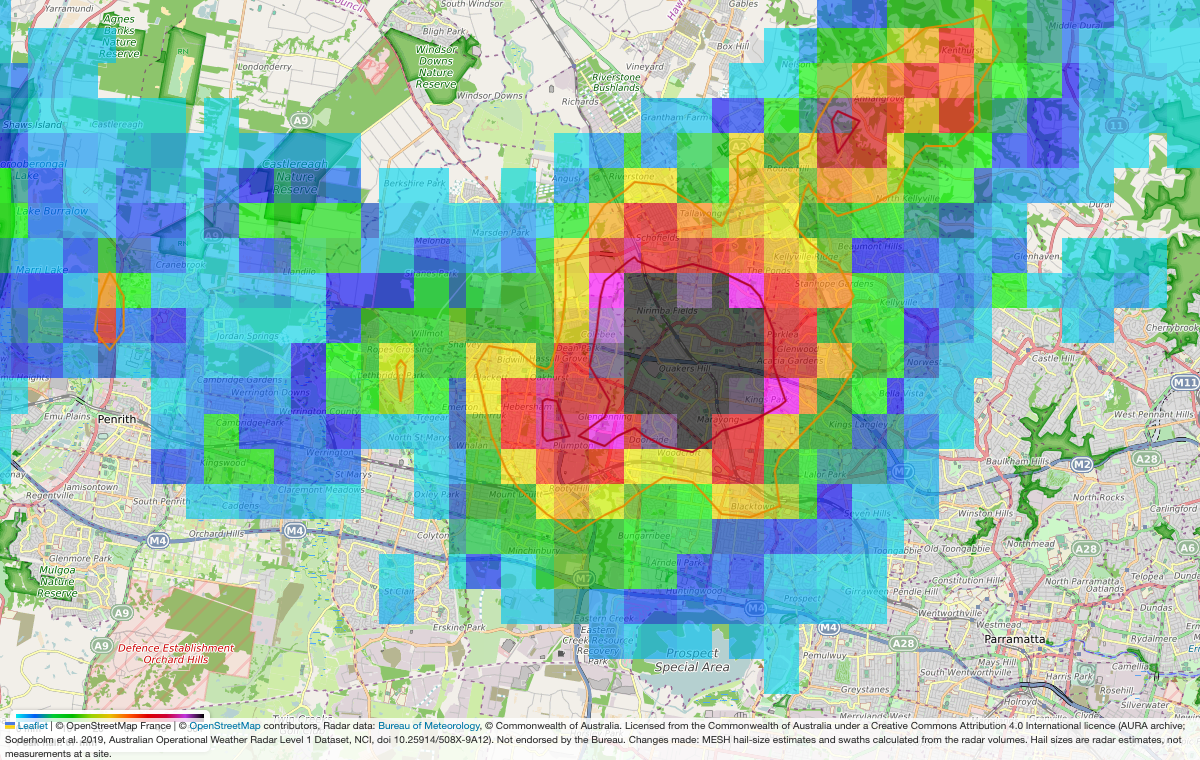
Quakers Hill, Marayong and Blacktown.
The quality of the data
- Source: Bureau of Meteorology weather radar, high resolution archive (AURA Level 1). Built about a day after the storm.
- Detail: the hail layer is made of squares about 1 km wide. You see which suburbs sit inside the swath and the estimated size, not individual houses.
- It is an estimate: sizes come from the radar and can read larger than the stones on the ground. Treat it as a guide to where the worst hail fell.
- Not a warning and not a certified report. Radar can miss hail in some places, especially far from a radar.
Three levels
Start free. Pay for the information, collated for you.
The event picture
- The whole event at a glance
- The colour levels explained
- Latest events
The detail
- Zoomable high resolution map
- Suburb lists with estimated hail sizes
- Sent to you after each event
As it happens
- Not available yet
- Needs the Bureau’s permission first
Register interest and we will tell you.
How it works
From radar to a list you can use.
- Storm happensWe watch the Bureau’s severe thunderstorm warnings.
- We build the mapFrom the high resolution radar archive, about a day after.
- We collate itSizes, suburbs and the damage picture, put together for you.
- You get itMembers receive the detail and can zoom in.